Following up on my previous post, I built a new Claude skill to take advantage of the increasing wealth of data online in cloud-native formats like GeoParquet. Given that DuckDB can read from such sources in place, I built the skill to use it to perform spatial analysis tasks on specified data sets. Here is an example using data in the HIFLD archive on Source Cooperative.
I keep coming back to this not for myself but for the many business users I work with who have ad hoc queries of spatial data they need to run. I usually hear from them after they have tried their luck with the business intelligence tools at their disposal. What I have learned is that these users prefer to use something familiar before reaching out and I am interested in the possibility that natural language can meet their needs.
First, here is the text (prompt) of the skill:
Perform spatial and tabular analysis between GeoParquet files using DuckDB. Use this skill whenever the user wants to analyze, query, join, compare, or extract insights from GeoParquet files — whether local or remote (e.g. from Source Cooperative, S3, HTTPS). Triggers on requests like “analyze this GeoParquet”, “spatial join between these two files”, “find all points within X km of”, “aggregate by polygon”, “which features intersect”, “count buildings per city”, “clip to this boundary”, “what’s the distribution of X in this dataset”, or any combination of geospatial and tabular analysis. Also triggers when the user provides a dataset URL (Source Cooperative, s3://, https://) and asks any analytical question. The skill selects the most appropriate DuckDB spatial operation based on the user’s query and datasets.
That’s it. It needs some tuning, and I’ll get into that in a bit. Here is my analysis prompt (I added the whitespace here for readability):
Using FEMA regions at https://data.source.coop/seerai/hifld/federal-emergency-management-agency-fema-regions/fema-regions/fema-regions.parquet/part-00000-tid-6231656750123480774-4a022913-4114-413b-8f79-7c0815d352ac-707-1-c000.zstd.parquet
and national forests at https://data.source.coop/seerai/hifld/national-forests/national-forest/national-forest.parquet/part-00000-tid-8467906346343896170-77b5a719-d92f-4a9d-b894-9b282b6f53ea-544-1-c000.zstd.parquet,
calculate total area of national forests, in square kilometers, by FEMA region.
It (un)helpfully produced this graph, which the astute reader will note that I did not ask for:
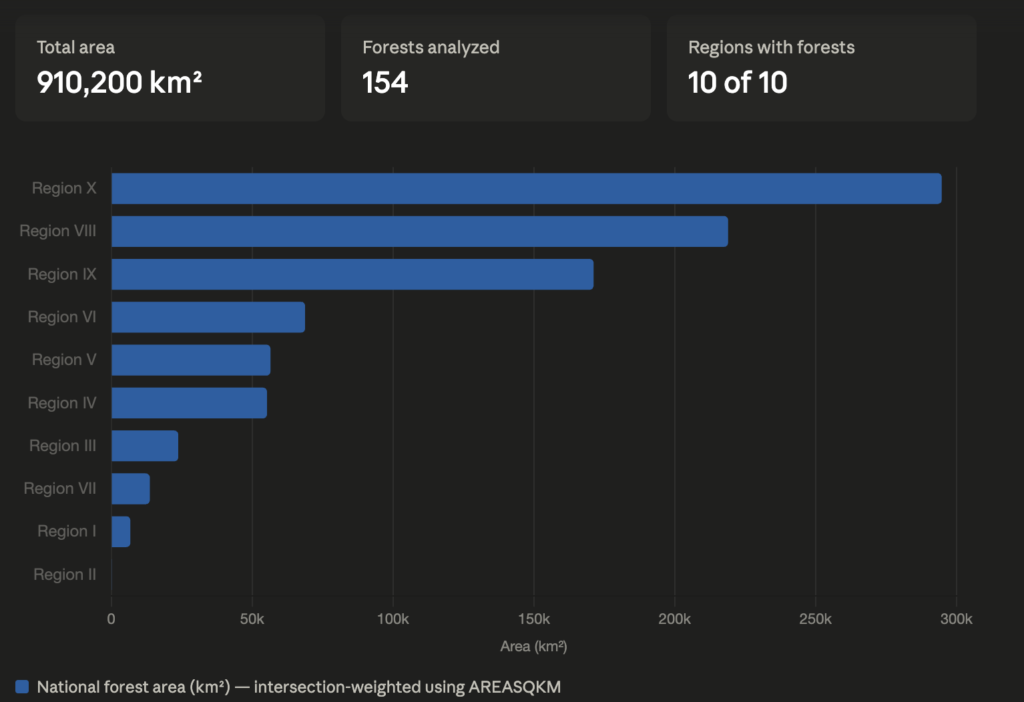
In the original result, you could hover over each bar to see the actual number, but that’s not visible in the above screenshot. I reproduced the query in DuckDB using dBeaver and got the following:
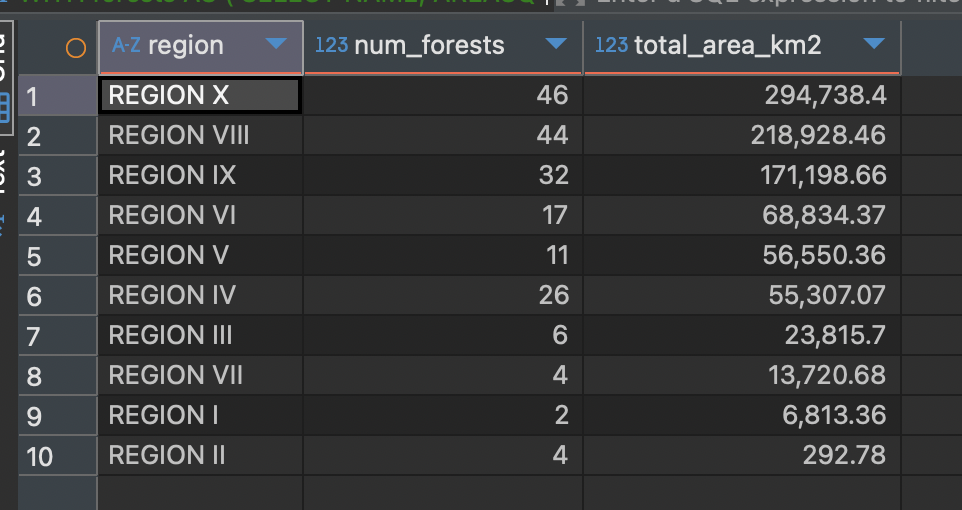
This matched Claude’s output perfectly, so that’s good.
While the skill produced the correct results, there were some practical limitations. I need to do some optimizations so that I don’t necessarily need to give specific URLs to the data sets. It may also be more useful to have the skill prefer STAC when it’s available, so that queries that can benefit from pre-fetch range requests can take advantage of them.
What worked well was that it got the correct result, reproducible through SQL. (It worked for other queries as well.) What worked less well is that Claude took a long time to plan its approach and produce the result. Also, it gave me a bar chart I didn’t ask for. My preference is to address this in the skill itself as much as possible.
The prompt above isn’t exactly natural language yet, so I think the current state of things is directionally appropriate, but not quite ready for production. That could be a function of my skills, rather than the capability of the model, but that remains to be seen. I’ll keep working on it.